
Nitrate molten salts are extensively used for sensible heat storage in Concentrated Solar Power (CSP) plants and thermal energy storage (TES) systems. They are the most promising materials for latent heat storage applications. By combining classical molecular dynamics and differential scanning calorimetry experiments, we present a systematic study of all thermostatic, high temperature properties of pure KNO3 and NaNO3 salts and their eutectic and ”solar salt” mixtures, technologically relevant. We first study, in solid and liquid regimes, their mass densities, enthalpies, thermal expansion coefficients and isothermal compressibilities. We then analyze the cP and cV specific heats of the pure salts and of the liquid phase of the mixtures. Our theoretical results allow to resolve a long-standing experimental uncertainty about the cP(T) thermal behaviour of these systems. In particular, they revisit empirical laws on the cP(T) behaviour, extensively used at industrial level in the design of TES components employing the ”solar salt” as main storage material. Our findings, numerically precise and internally consistent, can be used as a reference for the development of innovative nanomaterials based on nitrate molten salts, crucial in technologies as CSP, waste heat recovery, and advanced adiabatic compressed air energy storage.
Molten salts are the most used materials for thermal energy storage at high temperature. This is due to several physical properties that they exhibit, which are important in industrial applications related to energy. The first factor affecting the performance of a thermal energy storage (TES) system is the thermal stability of the materials used to store heat, i.e. the temperature interval where they are liquid. The thermal stability of nitrate molten salts (MNO3, M = alkali metal), allows the heat to be stored between ≈520 K and ≈890 K, an extended range of very high temperatures. This interval is typical for pure alkali nitrates (LiNO3, NaNO3, KNO3), while their mixtures show a lower freezing point (e.g. for the eutectic NaNO3-KNO3 mixture this is 495 K). This even larger thermal stability range fits the requirements of Concentrated Solar Power (CSP) plants which, as a consequence, use nitrate molten mixtures as a heat storage medium. By 2030, it is estimated a usage of ≈1.8 × 10 9 tons of nitrate mixtures in CSP plants 1 .
Despite this extensive use of molten salts in thermal energy management, many basic and challenging issues about these materials are still unresolved, both at the experimental and theoretical level. One crucial issue is the temperature dependence of cP(T) in their liquid phase, especially concerning nitrate molten mixtures. Experimentally, different dependencies have been found, from increasing, to constant, to decreasing with T 2,3,4,5,6,7 . For this reason, round robin tests have been launched within the scientific and technological communities 8 .
A technologically relevant nitrate mixture is the so called “solar salt”, which has a weight fraction composition given by \(__>=0.6\) and \(__>=1-__>=0.4\) . Industrially, for this mixture the most used empirical equation for the mass density ρ(T), at atmospheric pressure and within 530–890 K, is the function ρ(T) = α − β T, where α = 2.09 and β = 0.000636 9 . The empirical relation used for the specific heat is the T-increasing function cP(T) = γ + δ T where γ = 1.443 and δ = 0.000172 9 (the units of T, ρ(T) and cP(T) are K, g cm −3 and Jg −1 K −1 , respectively). This last equation is the result of many experimental measurements and statistical analyses all based on the use of Differential Scanning Calorimetry (DSC) 10,11 . However, an increasing cP(T) behaviour is more typical of weakly interacting liquids 12 , while nitrates belong to the class of strongly interacting ones.
In this rather complex experimental scenario, systematic theoretical results about thermostatic properties of molten salts and their mixtures are largely missing, while results for enthalpy H(T) and cP(T) of pure salts have been reported in ref. 13 .
As mentioned, empirical equations represent a key factor in establishing TES performances and have been crucial in the design of state-of-the-art CSP plants built recently 14 . Thus, revisiting them theoretically has a potentially high technological impact. Here, the validity of the mentioned cp relation will be investigated in detail and critically reconsidered.
Clearly, improvements in the performances of storage systems, connected to the energy production and reduction of electricity costs (e.g., of CSP plants), heavily rely on the maximum optimization of the thermodynamic properties of well known and new salt-based mixtures 15,16,17,18,19 .
In this work, we perform an extensive theoretical analysis, based on classical molecular dynamics (MD), of the temperature behavior of the thermostatic properties of NaNO3, KNO3 and their mixtures, with emphasis on the thermal behaviour of the specific heats cP(T) and cV(T), technologically relevant especially for the mixtures. The results are first compared with our new DSC experiments and with previous measurements. Then, they are interpreted by establishing a link between the solid-state approach to collective vibrational modes in liquids 20,21,22,23 , and the more standard gas-like approach 24,25 .
Our analysis is devoted to (i) provide a theoretical characterization, both in the solid and liquid phases, of the thermostatic properties of nitrate molten salts; (ii) resolve the issues related to the cP(T) thermal behavior in the liquid phase of relevant salt mixtures; (iii) validate the MD model 13 accuracy, for further studies about, e.g., nanofluids where the suspending medium are the nitrate salts studied here. The first two points are relevant for all the applications in the CSP technology and more generally in the field of renewable energy; the third, to develop an accurate theoretical framework able to study the thermodynamic properties of salt-based fluids for thermal energy storage 15,16,17,18,19 . Our calculations are supported by a self-consistency check on the precision of our numerical methodology, only possible thanks to the fact that all relevant thermostatic properties were investigated.
We will first investigate the thermostatic properties of pure potassium and sodium nitrates, in their solid and liquid regimes. Next, we will analyze the eutectic and “solar” mixtures with the ultimate goal to characterize the thermal behaviour of the specific heats in the liquid phases. All properties and methods to calculate them are described in the Methods Sections (MS).
In order to study via MD the KNO3 properties in a large temperature regime including various phases, the starting point is to locate the solid-to-liquid transition temperature TM, at P = 1 atm. We find \(_^=592.5\pm 2.5\,>\) , which is very close to the experimental value, \(_^=607\) K. This excellent agreement gives a first indication of the accuracy of the inter-atomic potentials used 13 .
Moreover, it is also the result of a MD procedure to locate TM, based on the temporal evolution of a two-phase system, as described in MS 1.4. The melting point is also reported in ref. 13 , where a different value (TM = 513 K ± 17 K) was obtained via a thermodynamic integration-based method.
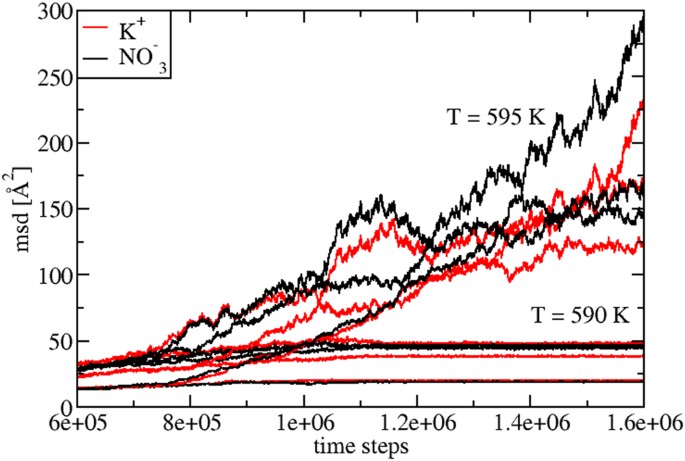
By following our procedure, in Fig. 1 we show the evolution of the three Cartesian components of the mean squared displacement (msd) of K + and \(>>_^\) at T = 590 K and T = 595 K. At T = 590 K ( \( < _^\) ), the msd shows a typical solid-like constant behavior, while at T = 595 K ( \( > _^\) ), a typical liquid-like behavior.
Experimentally, solid KNO3 shows three polymorphic forms at P = 1 atm 26 : a stable form at 299 K, denoted α-KNO3; a stable phase generated by heating at T = 403 K, β-KNO3; and a third, different metastable phase γ-KNO3 obtained by cooling down the system from high temperature, resulting from an alternative kinetic path.
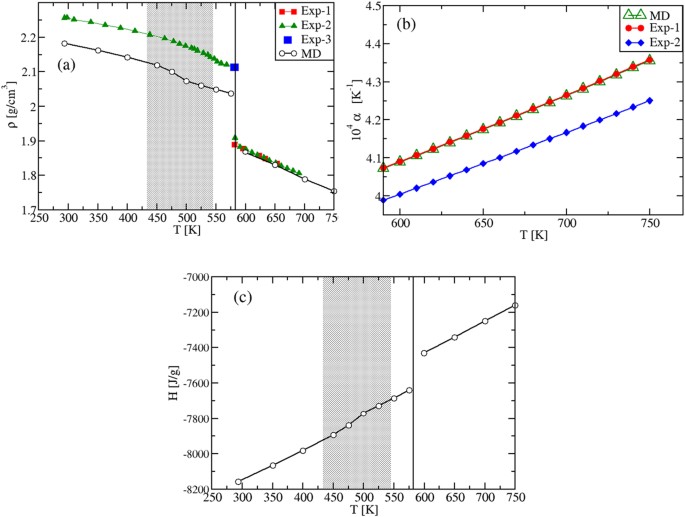
As we aim to characterize the specific heats in various phases, we preliminary analyze the density ρ(T) and the enthalpy H(T) temperature behavior. The results are presented in Fig. 2. Focusing first on the solid phases between 273 K and ≈600 K, we find that by heating up the α-KNO3 phase from T = 273 K, the calculated density shows a strongly non-linear behavior in the range T = [273,400] K, Fig. 2(a). This indicates the formation of a new phase, corresponding to β-KNO3. By cooling down the latter from T = 450 K, the density is once again non-linear, but the γ-KNO3 phase is obtained at room temperature.
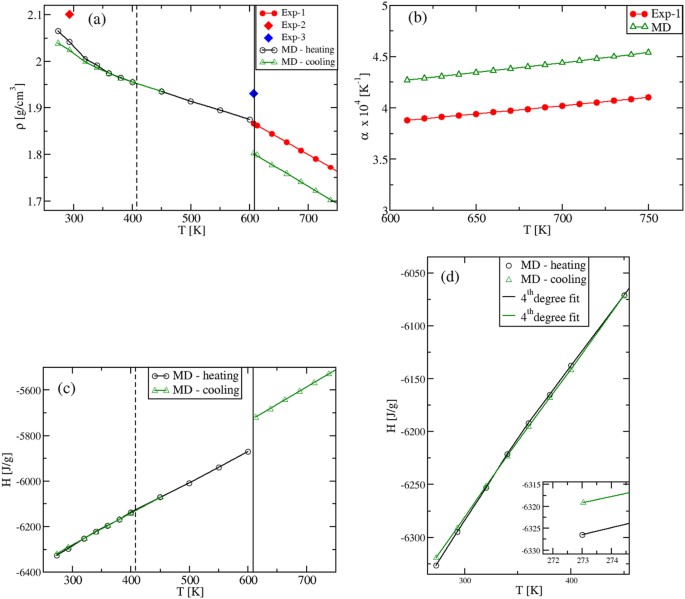
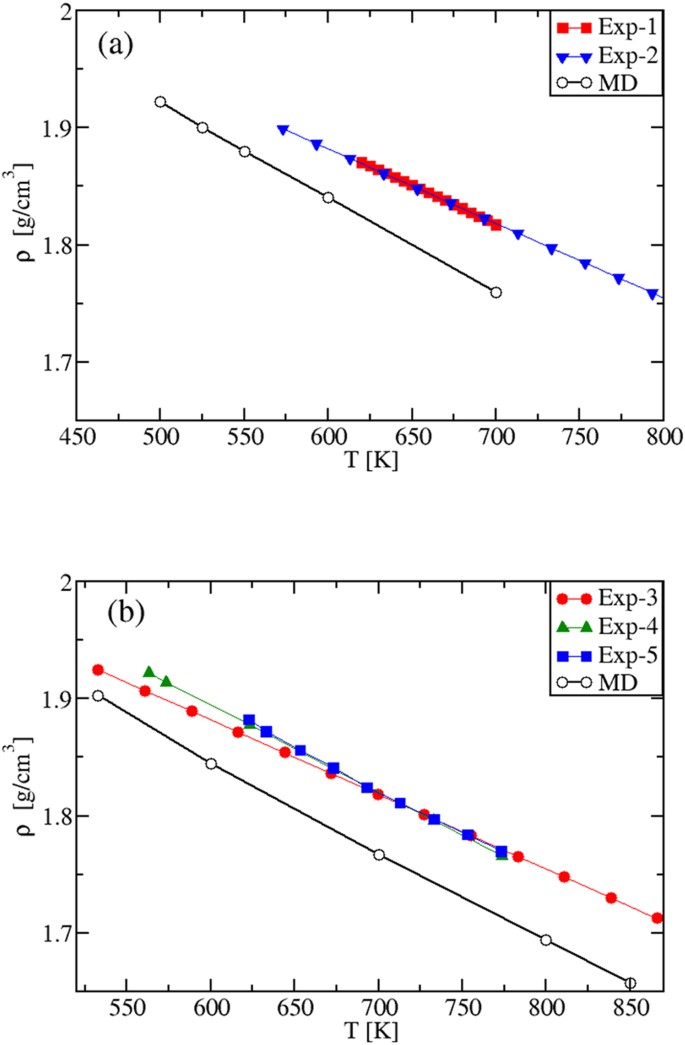
In the liquid region, the density ρ(T) is, instead, a linear function with a MD slope that coincides with the experimental one 27 . In this regime, our values confirm quantitatively the ones reported previously 13 . The slope, normalized by ρ(T), gives the thermal expansion coefficient α(T), shown in Fig. 2(b). The difference between experiment and theory in α(T) reflects only the difference in the corresponding values of the density, which is within 5% in the entire T-range investigated (at T = 293 K, ρ = 2.023 g cm −3 , while ρ exp = 2.101 g cm −3 ; at T ≈ 600 K, ρ = 1.8 g cm −3 , while ρ ex = 1.867 g cm −3 ). A good agreement is also obtained for the volume change at the experimental melting point, TM = 607 K. At \(_^=592.5\,>\) , the MD value is \(>_^/_^=4.03\) %, while the experimental change is \(>_^/_^=3.3\) % 27 . Again, these density results confirm the ability of the inter-atomic potentials 13 in describing the experimental findings.
We next calculate the enthalpy H(T) in the whole temperature interval. In Fig. 2(c,d), a non-linear T- behavior corresponding to the density one is found in the solid range. The two MD plots in Fig. 2(c) are obtained by heating up or cooling down the system, respectively (black and green symbols). The values at T = 273 K show that the stable phase is the α-KNO3 (Fig. 2(d) inset), while the metastable γ-KNO3 phase should transform into the former with time 28 . In the liquid phase we find the important result that our H(T) data are perfectly linear with the temperature. Finally, by extrapolating the solid and liquid H(T) to TM, the computed value for the melting enthalpy is \(>_^=130\,>/>\) , which is to be compared with the experimental value of \(>_^<\mathrm
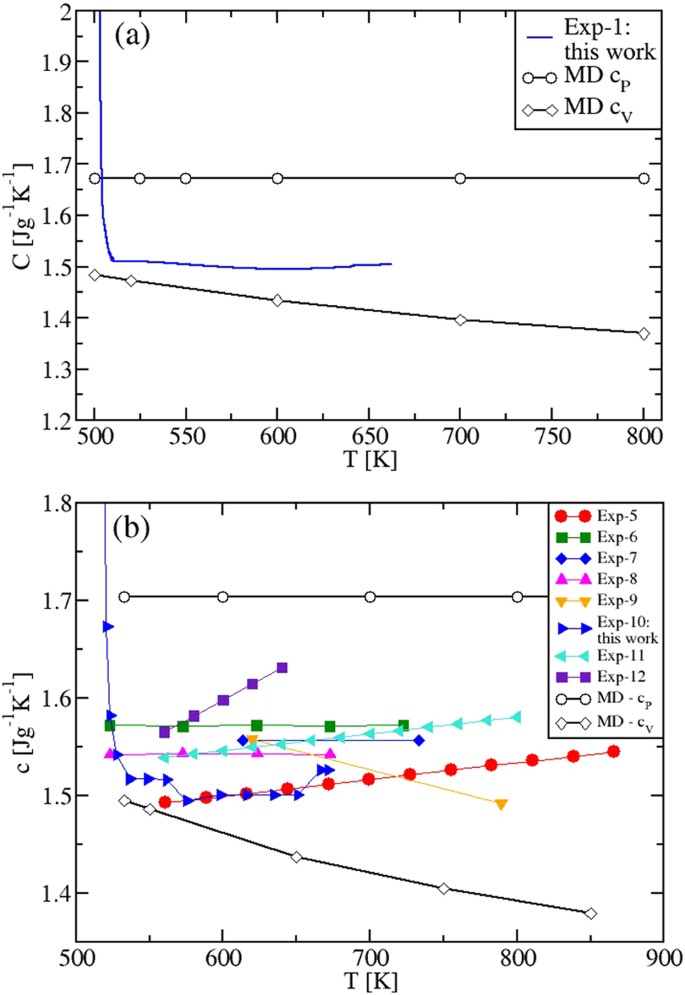
By performing the derivative of the MD enthalpy plots (fitting polynomials for H(T) were used), we now show the obtained specific heats (Fig. 3), and compare them with our experimental results and existing experiments 4 . The isobaric cP(T) is presented in Fig. 3(a). Remarkably, due to the H(T) non-linearity in the solid regime, the calculated cP shows a transition peak in correspondence of the solid-to-solid α-KNO3 → β-KNO3 transition (T ≈ 400 K) 26 and, still in accordance with the experimental data, a slightly increasing behavior until the melting TM is reached. Importantly, Fig. 3(b) shows that in the whole temperature range of liquid stability cP has a constant value, \(_^=1.518\) Jg −1 K −1 , in disagreement with previous theoretical results 13 .
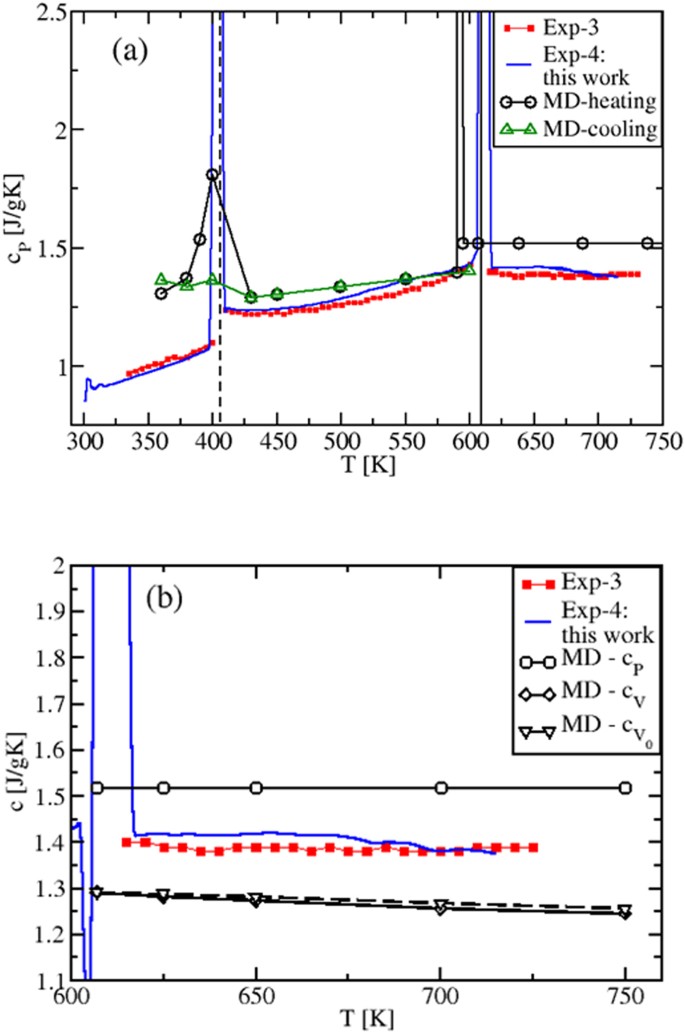
Figure 3(b) also shows the MD predicted cV(T) and \(__>(T)\) behaviors calculated, respectively, at constant (V) and at fixed volume (V0). The latter is chosen to be the volume immediately after the melting temperature 29 . As it is clear from the internal energy of the liquid state (Eq. (5), Sec. 1.2), the \(__>(T)\) decrease is purely due to the smoothing and broadening of the peaks in the pair distribution functions gij(r), while in the cV(T) decrease there is the additional contribution from the variation of V(T, P = 1 atm), via the density ρ(T).
In the gas-like approach to liquids 24,25 , the gij(r) smoothing and broadening correspond to less defined coordination shells around given ions, from which they can more easily escape or jump at increased temperature. In the solid-state approach of refs 20,21,22,23 , they correspond to a shorter time between two consecutive ion jumps, known as the Frenkel time τF (and to a larger frequency ωF). This results in a temperature decrease of the number of transverse oscillating modes, which has been identified as the main cause of the decrease of \(__>(T)\) 20,21,22,23 .
Since cP(T) can be written as cP(T) = cV(T)(1 + γαT), where γ is the Grüneisen parameter and α is the coefficient of thermal expansion and since, typically, γ is almost T-independent 30 , it follows that cP(T) is the product of a temperature decreasing term, cV(T), and a temperature increasing term containing αT 2,20 . As a result, cP(T) must be less, or not at all sensitive to temperature changes, as we actually find. This behavior is also consistent with the experimental results found for molten alkali and alkali earth halides 31 that, as KNO3, belong to the class of low viscosity ionic liquids. Previous cP(T) values 13 differ from our results, since cP(T) was determined by considering, on the top of the MD interaction model, internal degrees of freedom contributions to the kinetic ideal term that are T-dependent 13 .
The overall agreement between experimental data and MD results in T = [400, 725] K is very good if compared to the accuracy found in the literature 13 , the difference being cP experimental data are in between the cP and cV theoretical results and show a slight tendency to decrease and oscillate with increasing T. This could be a consequence of experimental conditions closer to constant V than to constant P (sealed and small sample holder used in DSC experiments).
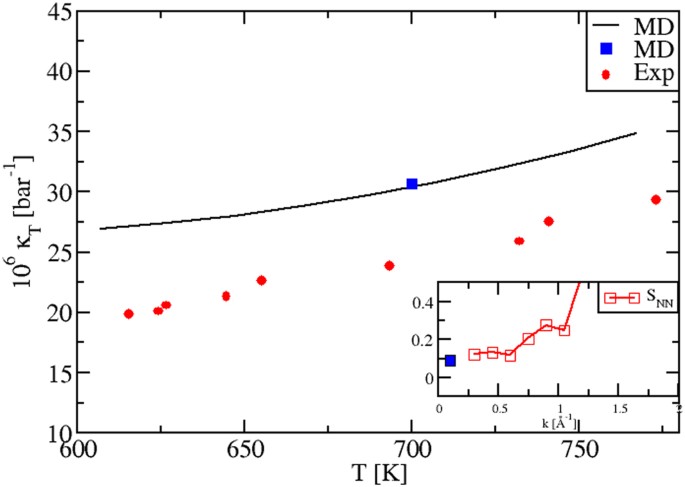
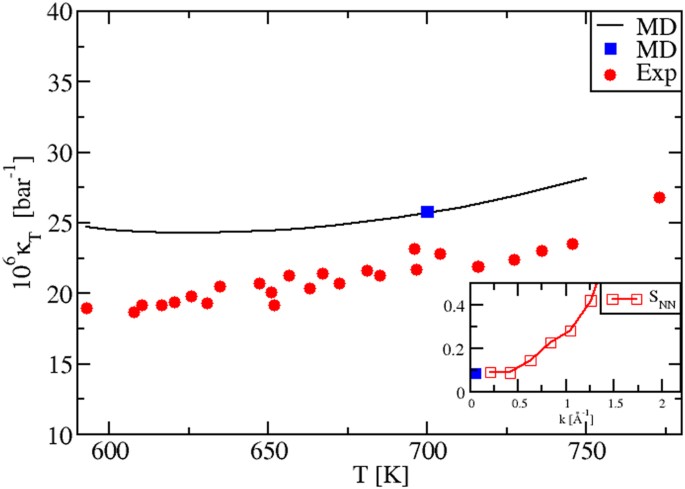
Our calculations reproduce correctly also the temperature dependence of the isothermal κT(T) in the liquid phase, Fig. 4. We evaluated κT(T) by using three different procedures, fully illustrated in Methods Section 1.3. The black plot stems from the relation κT = α 2 T/[ρ(cP − cV)]. The blue dot at T = 700 K is instead calculated via an alternative sequence of steps and the use of the equation κT = −V −1 (∂〈V〉/∂P)T. Importantly, we can see that these data perfectly superpose. This represents a severe test to check our numerical precision and consistency, for all thermostatic quantities not directly obtainable as MD averages. We have a further confirmation of this consistency. After a suitable rescaling (MS, Eq. (9)) the blue dot value was reported in the inset of Fig. 4, together with the SNN(k) Bhatia-Thornton structure factors 25,32,33 , which we also calculated at T = 700 K. As it is well known 25,32,33 , we have the relation \(\frac__T><\mathrm
We present now our results for NaNO3. To a large extent they exhibit similar features found in KNO3.
The NaNO3 melting temperature is calculated to be \(_^=594\,>\) , which is higher than the experimental value \(_^=581\,>\) 26 , but still in a reasonable agreement. ref. 13 reports 591 ± 18 K.
The mass density results are shown in Fig. 5(a). Also in this case, the experimental data in the solid range have a strong non-linear behavior, as in KNO3. In fact, at T = 433 K a second-order phase transition begins from the low temperature stable phase, denoted II-NaNO3, to the high temperature phase, I-NaNO3 34 . The transition is complete at T = 544 K 26 , and it is due to the activation of the rotational degrees of freedom of the nitrate groups 35 . In this temperature range, the theory-experiment discrepancy is found to be less than 4% at T = 293 K (ρ MD = 2.181 g cm −3 , while ρ exp = 2.257 g cm −3 ), and the strong non-linearity is also well reproduced. Also in this case our values confirm quantitatively the ones reported previously 13 . In the liquid phase, both the ρ(T) linear behavior and the set of experimental data are perfectly reproduced. However, we need to consider that in the liquid range, the experimental data refer to systems where, intrinsically, both sodium nitrates and nitrites are present (see ref. 2 and references therein), while our MD results refer to pure NaNO3. Still, although this level of precision might be quite accidental, the interaction potentials used show to be, once more, highly accurate. This is also true for the liquid branch of the thermal expansion coefficient, shown in Fig. 5(b), where we see that the theoretical and experimental 36 results essentially superpose.
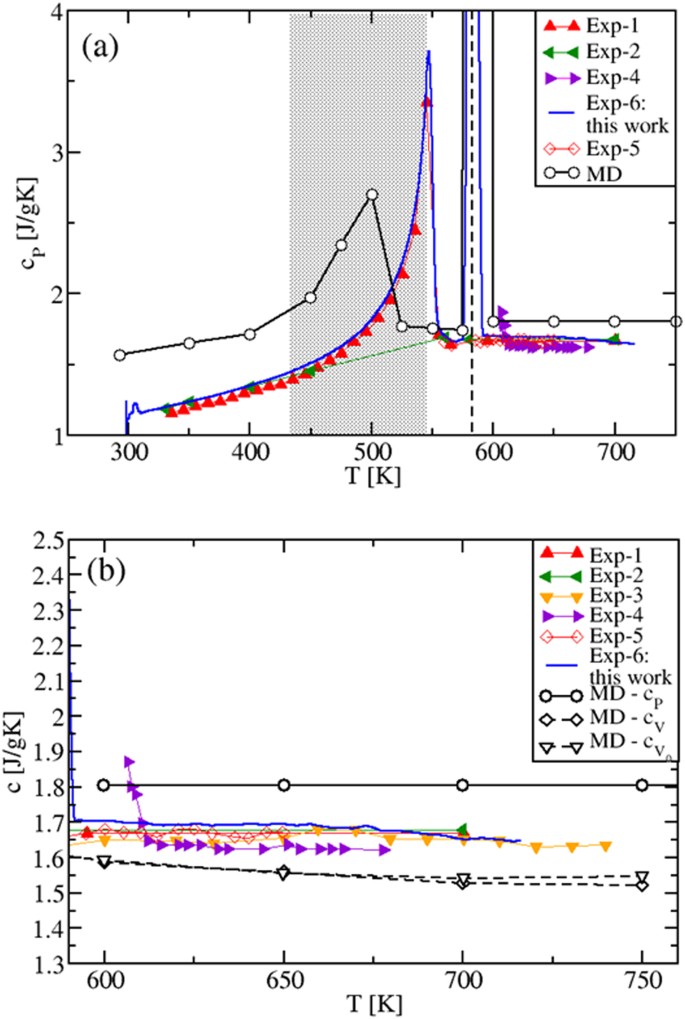
The enthalpy H(T) is reported in Fig. 5(c). As for the density, the enthalpy is non-linear in the solid phase and linear in the liquid region. By extrapolating the solid and liquid enthalpies to the experimental \(_^=581\) K, a value of \(>_^=173\) J/g is obtained, in quantitative agreement with the experimental value, \(>_^\in 172-187\) J/g 2 .
The cP values are shown in Fig. 6. In the solid phase, cP increases with T, and shows a peak in the same region where the second-order phase transition is experimentally observed 26,34 . This transition is also evident from the cP(T) increase observed in our DSC experimental data, also reported in the same Figure. In the liquid phase, cP(T), analogously to KNO3, has a constant value for all the investigated temperatures ( \(_^=1.805\) Jg −1 K −1 ), as shown in Fig. 6(a,b). Experimental cP(T) data are either constant, as the MD results, or exhibit a decreasing behavior. The comparison between our experimental and theoretical results show a difference of ≈7%. Instead, our MD cV(T) and \(__>(T)\) show a decreasing behavior.
Finally, as shown in Fig. 7, the T-behavior of the experimental isothermal compressibility κT(T) in the liquid regime is also well reproduced by our MD modeling. A similar self-consistency test as for KNO3, based on the use of three calculation procedures was performed for NaNO3. The test was successful, as shown by the coincidence of the black plot and the blue dot in Fig. 7 and by the correct behavior of the Bhatia-Thornton structure factors SNN(k), tending to κT at the k → 0 limit. Hence, all the considerations on accuracy and precision made for the KNO3 isothermal compressibility apply here too.
Molten salt mixtures are technologically extremely relevant, especially when considered in their liquid phase. The characterization of their thermostatic properties is important not only for a fundamental understanding of the physics of ionic liquids at high temperature, but also for energy applications in any system containing a heat storage component. In this respect, it is also important the development of viable simulation methods to determine technological relevant binary and ternary molten salt eutectics 37 . In the following we will calculate, in the liquid phase only, the thermostatic properties of two relevant nitrate molten salt mixed systems: the eutectic and the “solar” mixture. Emphasis is given on the specific heats thermal behavior, where the available experiments still exhibit a high degree of controversy 4,5,6,7 .
The eutectic NaNO3-KNO3 mixture has the chemical composition Na0.5K0.5NO3. Due to the lower mass of Na, this corresponds to a 45.67% NaNO3–54.33% KNO3 weight percentage composition. The “solar salt” mixture has a higher content of Na, with a chemical composition of Na0.641K0.359NO3 and a weight percentage of 60% NaNO3–40% KNO3.
The density plots for both systems are shown in Fig. 8. The theory-experiment agreement is satisfactory. However, while for the pure salts the difference between experimental and modeling results is the same in the whole liquid phase, here the discrepancy increases as the temperature increases. This behavior could be related to the use of the Lorentz-– Berthelot approximation 38 to describe the crossed interaction between Na + and K + particles, which is the only approximation introduced in passing from the pure components to the mixtures.
The specific heats of the mixtures are shown in Fig. 9(a,b). Importantly, we found again that the calculated values of cP are temperature independent. They are 1.673 Jg −1 K −1 and 1.704 Jg −1 K −1 for the eutectic and the “solar” mixture, respectively. The specific heat cV(T), instead, is predicted to be a decreasing function of T. As the simulations allow to compute the specific heats by keeping either the volume or the pressure strictly constant, we speculate that all the observed systematic discrepancy between the cP(T) experimental and MD results can be due to the fact that in DSC experiments aimed at measuring cP(T), the control of the experimental conditions is rather challenging, especially in the case of ionic liquids. For instance, inside the sealed sample holders partially filled by a small amount of sample, a very high and variable pressure can be generated, with the sample changing its volume as the temperature is changed. Ionic samples present extra difficulties due to the non-wetting of the sample holder surfaces. This complexity is reflected in the variety of cP(T) behaviors with temperature, as measured by DSC. As shown in Figs 3(b), 6(b) and 9(a,b), cP(T) is found to decrease, to be constant and to increase. Our MD results clarify, once for all, that working at constant pressure a constant value of cP(T) is produced, while at constant volume a decreasing cV(T) is predicted.
As a conclusion for technological applications, we then propose to reconsider the use of empirical equations showing a cP(T) temperature-dependent behavior for any molten K-Na nitrate mixture (see, e.g., the increasing cp(T) used industrially, Exp. 11 9 in Fig. 9(b)). We estimate that such a behavior, bringing, e.g., to a 5% overestimate of the real cp(T) value, corresponds to a loss of 0.75 h/day of electricity production in a CSP plant with a “solar” salt tank able to store energy for 15 h. On a yearly basis (and for a typical 50 MW plant), this traslates in the considerable loss of ≈12 GWh/year in the electricity production.
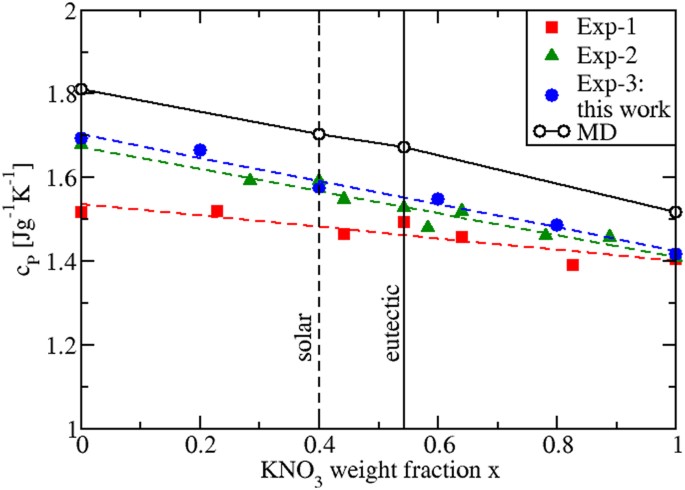
Due to the fact that the calculated cP values of the pure and mixed salts are T-independent, cP can be plotted against the weight fraction x of KNO3 present in the mixture. This is done in Fig. 10, where we see that by interpolating the calculated values of the four investigated compositions (pure NaNO3, eutectic, “solar salt” and pure KNO3), cP changes linearly. Although the experimental data in Fig. 10 refer to different temperatures, a linear behavior can be also identified. We then conclude that mixtures of KNO3 and NaNO3 behave as ideal mixtures. Thus, to determine the cP(x) of any mixture, no extra measurements or simulations are needed, as it is sufficient to consider a linear combination of the pure salts values with their respective weight fractions, i.e. \(_(x)=x_^_>+\mathrm<(1>-x)_^_>\) .
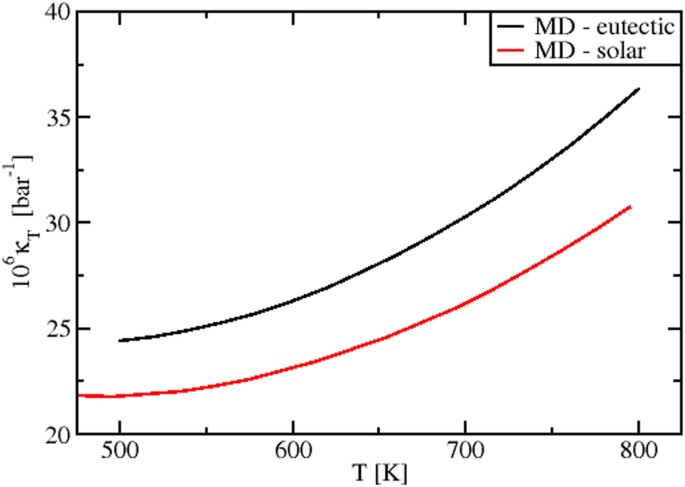
The MD values of the isothermal compressibility κT(T) are reported in Fig. 11. These data are the first prediction appearing in literature. By considering the accuracy of the MD results for the pure salts, highlighted in previous sections, they can be used as reference for further studies, both experimental and theoretical.
In this work, by combining classical molecular dynamics (MD) simulations and differential scanning calorimetry (DSC) experiments, we investigated the thermostatic properties of nitrate molten salts, technologically relevant materials for thermal energy storage applications. We focussed, in particular, on the thermal behavior of the specific heats of KNO3, NaNO3 and their eutectic and “solar” mixture, the latter known as “solar salt”. The motivation of our work is twofold: First, to the best of our knowledge, theoretical calculations about the thermostatic properties in the solid and liquid phase of these materials are largely missing. Second, there is a general lack of consensus about the experimentally measured specific heats as a function of temperature, especially for what concerns cP in the liquid phases.
To address these issues, we first computed the mass density, the enthalpy and the thermal expansion coefficient of pure nitrate salts, as a function of temperature. Moreover, we calculated the melting transition temperature TM and the enthalpy and the volume changes at TM. We obtained an accurate theoretical description, reproducing quantitatively the available experimental data. This allowed to reproduce several non-trivial features of solid-solid and solid-liquid phase transitions in the case of the pure salts.
Next, we characterized the specific heats in the pure salts, and, due to their technological relevance, in the mixtures. For all investigated liquid systems, we found a constant value of cP(T), while cV(T) is weakly decreasing with temperature.
Finally, we calculated the isothermal compressibility κT(T), encompassing other thermostatic properties, in excellent agreement with the experiment. This fact, together with a careful, self-consistency check based on three independent procedures to calculate this quantity, fully validates our MD numerical scheme. Thus, we expect that our results for the eutectic and “solar” mixtures have the same degree of accuracy.
The constant value of cP(T) in the liquid regime clarifies a complex experimental picture, especially in the case of the “solar” mixture, where more experimental data are available. In view of this, for this material we suggest to reconsider the empirical T-increasing function cP(T) = γ + δ T, used in the design of thermal energy storage components.
For the eutectic and “solar” salt our results also allow to say that these materials behave as ideal mixtures, i.e. the cP of any mixture can be obtained from the cP of the pure salts only.
We believe that our results are of general validity and not limited to the class of nitrate molten salts. They confirm many temperature trends observed in the thermostatic properties of strongly interacting liquids (e.g the condensed phases of alkali halides 31 ). They provide guidelines for researchers who perform experiments on the development of salt-based fluids for thermal energy storage. These include bulk nanomaterials and colloidal suspensions in ionic compounds.
Future studies will require theoretical reference data and validated models about basic materials that compose more complex nanomaterials, as the ones provided in this work.
The used classical MD model is based on a version of the Fumi and Tosi pair interaction potential 39,40 , i.e. the Buckingham potential, superimposed to a Coulomb potential. The inter-atomic parameters of the Buckingham potentials are taken from S. Jayaraman et al. 13 . This parametrization has been chosen because: (i) it reproduces the liquid and crystal phase densities of the pure KNO3 and NaNO3 within 4% of the experimental data 13 ; (ii) it reproduces the MD partial pair distribution functions, gij(r), of the pure NaNO3 evaluated by A.K. Adya et al. 41 with a Born-Mayer-Huggins type of interaction potential. The latter reproduces the experimental structure factor extracted from the measured X-ray diffraction intensity 41 . No further refinements of the interaction parameters, and no other approximations beyond the Lorentz– Berthelot approximation 38 , needed for the cross interaction parameters in the mixture case, are made. The model is sufficiently accurate for the purposes of the present study. Simulations have been performed with the LAMMPS code 42,43 . Initial solid configurations are taken from ref. 13 . The NaNO3 initial solid configuration at T = 293 K corresponds to the rhombohedral \(R\bar>>c\) group with Z = 6, a = 5.070 Å, c = 16.82 Å. The KNO3 initial solid configuration at T = 293 K corresponds to the orthorhombic Cmc2 group with Z = 16, a = 10.825 Å, b = 18.351 Å, c = 6.435 Å. The initial liquid configurations have been generated with the PACKMOL package 44 . To study the pure salts, systems with 600 cations and 600 \(>>_^\) ions, for a total of 3000 particles, were constructed. To study the mixtures, 600 \(>>_^\) ions have been used while the cation numbers were 300 Na + and 300 K + for the equimolar mixture, and 384 Na + and 216 K + for the solar mixture. A time-step of 1 fs has been used. Systems were equilibrated using 10 6 time-steps and run with further 10 6 − 2 × 10 6 time-steps. For the solid (liquid) systems, equilibrated configurations at the lowest (highest) studied temperature were used as input for the closest next higher (lower) temperature. Other relevant parameters used are: Nosé-Hoover barostat time constant 0.5 ps; Nosé-Hoover thermostat time constant 0.1 ps; Buckingham and Coulomb interaction cutoff distance rc = 12 Å for systems with K + ions, and rc = 11 Å for other cases; long-range force calculation accuracy 10 −4 . Production runs in NPT simulations were considered suitable for analysis only when the averaged equilibrated pressure was within 〈P〉 = 1 ± 1 atm. Within this range, the change in the averaged 〈H〉 is \(\le 1\times ^ \% \) .
Thermodynamically, the specific heats cV and cP are defined as: